
A marketing budget dashboard helps you track expenses, monitor performance, and make smarter decisions across platforms like Google Ads, Meta, and TikTok. Here's why it's useful and what you'll need to get started:
-
Key Benefits:
- Track spending in real time to avoid budget overruns.
- Quickly identify and adjust underperforming campaigns.
- Link ad spend to revenue for better decision-making.
- Forecast future needs based on historical performance.
-
Must-Track Metrics:
- CAC (Cost Per Customer): Total marketing spend ÷ new customers.
- ROAS (Return on Ad Spend): Revenue ÷ ad spend.
- Channel Budget Tracking: Monitor spend and performance across platforms like paid social, search ads, email marketing, and display ads.
-
Tools You’ll Need:
- Google Sheets (simple and free), Google Data Studio (custom visuals), or Tableau (advanced analytics).
- Connect data sources like Amazon, Shopify, and ad platforms for automated updates.
-
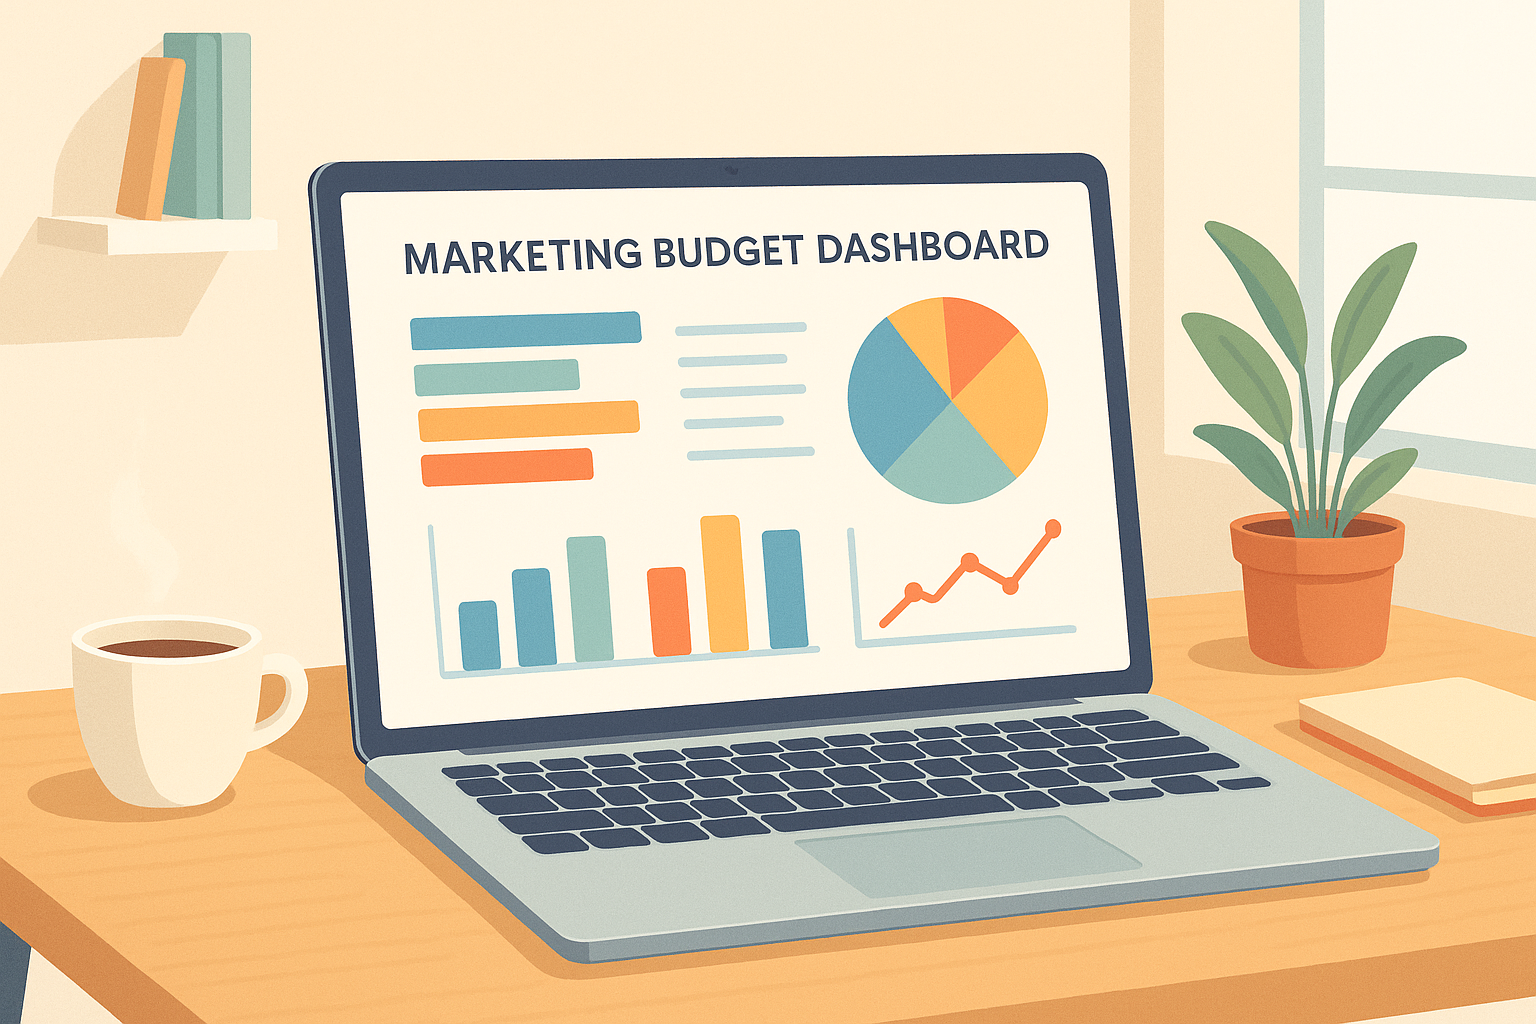
Dashboard Layout:
- Use clear visuals like bar charts, line graphs, and progress bars.
- Highlight key metrics at the top and group related data together.
-
Best Practices:
- Automate daily data refreshes.
- Use consistent US formats (e.g., $1,234.56, MM/DD/YYYY).
- Keep the design simple with 3-4 chart types and clear labels.
Marketing Budget Dashboard
Must-Track Marketing Metrics
Understanding key metrics is crucial for making informed decisions and refining your marketing strategies. Let’s break down some of the most important ones.
Cost Per Customer (CAC)
CAC tells you how much you're spending to acquire each new customer. To calculate it, divide your total marketing spend by the number of new customers acquired during the same period.
You can analyze CAC across different factors, such as:
- Marketing channels
- Campaign types
- Product categories
- Customer segments
Set alerts to flag when CAC surpasses a certain threshold. This helps ensure your spending stays in line with profitability goals.
Ad Spend Returns (ROAS)
ROAS (Return on Ad Spend) measures how much revenue you earn for every dollar spent on advertising. The formula is straightforward: divide revenue from a campaign by the total ad spend.
Key areas to monitor for ROAS include:
- Performance by platform (e.g., Meta, Google Ads, TikTok)
- Results across different campaigns
- Revenue generated by specific products
- Seasonal or time-based trends
A good starting point for ROAS is 2.0 (meaning $2 in revenue for every $1 spent). However, your ideal ROAS depends on factors like profit margins and your overall business model.
Channel Budget Tracking
Keeping tabs on how much you're spending across different channels helps you allocate your budget more effectively. Here’s a quick breakdown of what to track by channel:
| Channel Type | Key Metrics to Track |
|---|---|
| Paid Social | Daily spend, CPM, CPC |
| Search Ads | Keyword costs, conversion rates |
| Email Marketing | Campaign costs, open rates |
| Display Ads | Impression share, CTR |
For example:
- Paid Social: Compare engagement rates to spending.
- Search Ads: Assess how keyword positions affect CPC.
- Email Marketing: Focus on cost per conversion.
- Display Ads: Check viewability rates against ad spend.
Tools and Data Setup
Choose the right tools and connect your data to create a marketing dashboard that works for your business.
Dashboard Software Options
Pick software that aligns with your team's needs and goals. Here's a quick comparison:
| Software Type | Best For | Key Features | Learning Curve |
|---|---|---|---|
| Google Sheets | Small businesses | Free, real-time collaboration, basic charts | Low |
| Google Data Studio | Mid-sized teams | Free, integrates with various data sources, custom visuals | Medium |
| Tableau | Enterprise teams | Advanced analytics, powerful visualizations, automation | High |
When deciding, consider:
- How many data sources you need to connect
- Your team's technical skills
- How often the data should update
- The level of visual detail you require
Platform Data Connection
Connect your data sources efficiently with these methods:
-
Amazon Seller Central
Use API connections to pull in metrics like ad spend, sales performance, and campaign outcomes. -
Shopify Analytics
Export data or use API connections to access key insights, such as:- Marketing campaign performance
- Customer acquisition costs
- Sales by channel
- Ad performance metrics
-
Other Platform Integrations
Ensure your dashboard supports:- Multiple data sources
- Automated data updates
- Standardized formats
- Consistent decimal formatting
Set up daily automatic refreshes and use US formats (e.g., $1,234.56 and MM/DD/YYYY) to keep your data current and actionable.
With these connections in place, you’ll have a strong foundation for building a clear and functional dashboard.
Building Your Dashboard
Setting Dashboard Goals
Start by defining clear, measurable goals for your dashboard. Focus on these key areas:
- Primary KPIs: Track metrics like CPA, ROAS, and how each channel is performing.
- Budget Tracking: Keep an eye on spending across all marketing channels.
- Performance Alerts: Set notifications for when metrics fall outside acceptable ranges.
Dashboard Layout and Charts
Here’s a recommended layout for your dashboard:
| Section | Key Metrics | Suggested Chart Type |
|---|---|---|
| Budget Overview | Total spend vs. budget | Progress bar or gauge |
| Channel Performance | ROAS by channel | Bar chart or line graph |
| Cost Analysis | CPA trends | Line chart with moving average |
| Campaign ROI | Revenue vs. spend | Combo chart (bar + line) |
Place the most important metrics at the top for quick access. Group related data together and use consistent color schemes to make the information easy to understand at a glance.
Data Updates and Reviews
Keep your dashboard accurate and reliable with these steps:
1. Update Schedule
- Automate daily data refreshes during off-peak hours.
- Set up alerts to notify you of any data connection issues.
2. Review Process
Dedicate 30 minutes each week to review the dashboard. Use this time to validate the data, identify trends, adjust budget allocations, and document key insights.
3. Maintenance Protocol
Once a month, perform routine maintenance. Check data connections, update performance thresholds, archive old data, and refine the dashboard layout.
These practices will ensure your dashboard remains effective and ready for the next steps in data visualization.
sbb-itb-d7b5115
Data Display Best Practices
Clear and effective data presentation is crucial for making timely adjustments and maintaining precise budget control. By refining your dashboard design with these practices, you can ensure your data is both easy to understand and actionable.
Chart Selection Guide
Selecting the right chart for your marketing budget data is key. Use this guide to match your data type with the most effective visualization:
| Data Type | Recommended Chart | Best Use Case |
|---|---|---|
| Budget Distribution | Pie or Donut Chart | Show percentages allocated by channel |
| Spend Over Time | Line Chart | Monitor daily or weekly spending trends |
| Channel Comparison | Bar Chart | Compare ROAS across different platforms |
| Goal Progress | Gauge or Progress Bar | Display how much budget has been used |
| Multi-metric Analysis | Combo Chart | Compare metrics like spend vs. conversions |
Tips for Effective Charts:
- Use only 3-4 chart types per dashboard to avoid clutter.
- Assign consistent colors to each channel for instant recognition.
- Include hover tooltips for more detailed data points.
- Ensure charts are mobile-friendly and readable on smaller screens.
US Format Standards
Currency Display
- Place the dollar sign before numbers: $1,000 (not 1,000$).
- Include cents only for precise amounts: $1,499.99.
- Use commas for large numbers: $1,000,000 (not $1000000).
Date Formatting
- Standard format: MM/DD/YYYY (e.g., 04/25/2025).
- Abbreviate months as needed: Jan, Feb, Mar, etc.
- Use 12-hour time with AM/PM: 9:30 AM.
Number Presentation
- Decimal separator: Period (.), not a comma.
- Thousand separator: Comma (,).
- Percentages: Display with one decimal place (e.g., 15.7%).
- Large numbers: Use K for thousands and M for millions (e.g., $50K, $1.2M).
Visual Hierarchy
For maximum readability:
- Use 16-18pt font for primary metrics.
- Use 12-14pt font for secondary metrics.
- Use 10-12pt font for supporting text.
- Highlight key figures with bold text and use italics for comparisons, like period-over-period changes.
This structured approach ensures your dashboard is logical and easy to interpret, helping you make informed decisions faster. Next, we'll explore funding options to support your well-planned budget.
Marketing Budget Funding
Securing marketing funding is crucial for scaling eCommerce businesses. By integrating funding insights into your marketing dashboard, you can effectively track both investments and returns.
Sales-Based Financing
Revenue-based financing allows repayments to align with your sales performance. This approach is especially useful for marketing budgets, as it adjusts to your sales cycles.
| Dashboard Metric | What to Track | Why It Matters |
|---|---|---|
| Marketing Fund Allocation | Total funding received | Helps you track available campaign funds |
| Sales Performance | Daily/weekly revenue | Monitors repayment capacity |
| Campaign ROI | Revenue vs. spend ratio | Evaluates funding effectiveness |
| Repayment Progress | Percentage of funding repaid | Aids in planning future investments |
Budget and Funding Planning
Using funding models effectively means integrating capital insights into your dashboard for real-time tracking. If your eCommerce business generates at least $3,000 in monthly sales, platforms like Onramp Funds can provide marketing capital within 24 hours of approval. This allows you to seize time-sensitive marketing opportunities while keeping your budget on track.
Funding Allocation Tracking
- Display available funding in real time
- Monitor how funds are distributed across marketing channels
- Track spending against the allocated funding
Performance Monitoring
- Compare daily sales with the performance of funded campaigns
- Measure ROI in real time to assess campaign success
"Onramp has simplified cash flow by automating everything: easy to request, set it and forget it payments - quick and fast!" - Torrie V., Founder and Owner of Torrie's Natural
Dashboard Integration Tips
- Show fund utilization as a percentage
- Set alerts for performance thresholds
- Automate reporting for funded campaigns
"Onramp offered the perfect solution with revenue-based financing to secure the capital we needed to invest in inventory and pay it back at a reasonable time frame once we made sales. The process was quick, easy, and the support was great." - Jeremy, Founder and Owner of Kindfolk Yoga
Next Steps
Make the most of your dashboard with these practical steps:
Set a Regular Review Schedule
Dedicate time each week to review performance metrics and plan your next moves.
Keep Your Dashboard Updated
Set up a quarterly review process to ensure your dashboard stays in sync with your business needs. During these reviews, you can:
- Check if your metrics are still relevant
- Add new KPIs when needed
- Remove outdated tracking elements
- Update visualization formats to make data easier to understand
Once you've gathered insights, turn them into actionable steps:
| Insight Type | Action Items | Review Frequency |
|---|---|---|
| Performance Alerts | Set up notifications for thresholds | Weekly |
| Trend Analysis | Adjust budget allocations | Bi-weekly |
| ROI Tracking | Refine spending on key channels | Monthly |
| Funding Impact | Evaluate marketing capital needs | Quarterly |
Focus on Continuous Improvement
Keep refining your dashboard by:
- Experimenting with different chart styles for better clarity
- Boosting performance with automated data refreshes and custom views tailored to your team
- Generating specific performance reports to address key areas
Looking to scale your marketing efforts? Onramp Funds offers equity-free financing with fast approvals for qualified businesses, helping you act quickly on the insights you uncover.
"Onramp has simplified cash flow by automating everything: easy to request, set it and forget it payments - quick and fast!" - Torrie V., Founder and Owner of Torrie's Natural
"Onramp offered the perfect solution with revenue-based financing to secure the capital we needed to invest in inventory and pay it back at a reasonable time frame once we made sales. The process was quick, easy, and the support was great." - Jeremy, Founder and Owner of Kindfolk Yoga
Use these strategies to ensure your dashboard continues to meet your business's evolving needs.
FAQs
What key metrics should I focus on when creating a marketing budget dashboard?
When building a marketing budget dashboard, focus on tracking metrics that provide clear insights into your spending and performance. Key metrics to prioritize include:
- Total Marketing Spend: Monitor how much you’re investing across all channels.
- Return on Ad Spend (ROAS): Measure the revenue generated for every dollar spent on advertising.
- Customer Acquisition Cost (CAC): Understand the cost of acquiring a new customer.
- Conversion Rate: Track the percentage of users who complete a desired action, such as making a purchase.
- Lifetime Value (LTV): Evaluate the total revenue a customer brings over their lifetime.
These metrics help you assess the effectiveness of your marketing efforts and make data-driven decisions to optimize your budget. For eCommerce businesses, platforms like Onramp Funds can support your growth by providing flexible funding solutions to invest in marketing and scale efficiently.
How can I keep my marketing dashboard updated automatically for real-time accuracy?
To automate data updates for your marketing dashboard and ensure real-time accuracy, you can integrate tools like Google Sheets, Excel, or specialized dashboard software with your marketing platforms. Many tools offer APIs or built-in connectors to sync data automatically from sources like ad platforms, eCommerce stores, or analytics tools.
For example, platforms like Shopify or Amazon often provide integrations that allow you to pull sales, ad spend, and other key metrics directly into your dashboard. Additionally, using automation tools like Zapier or Make (formerly Integromat) can help you set up workflows to update your data seamlessly. This ensures your dashboard reflects the latest performance metrics without manual input, saving you time and reducing errors.
What are the best tools for creating a marketing budget dashboard for businesses of different sizes?
When building a marketing budget dashboard, the tools you choose depend on the size and needs of your business. For small businesses, user-friendly options like Google Sheets or Microsoft Excel are cost-effective and offer flexibility for tracking key metrics. Medium-sized businesses might benefit from more robust tools like Tableau or Looker, which provide advanced data visualization and integration capabilities. Larger enterprises often rely on comprehensive platforms like Power BI or Domo, which can handle complex data and offer scalability.
For eCommerce businesses, platforms like Shopify or Amazon Seller Central can integrate with these tools to pull relevant sales and marketing data directly into your dashboard. Additionally, if you're looking to scale your marketing efforts, Onramp Funds can provide tailored funding solutions to help you invest in your campaigns effectively and manage cash flow efficiently.
